| Target Load |
Actual Load |
ssj_ops |
| Target |
Actual |
| Calibration 1 |
|
|
3,073,158 |
| Calibration 2 |
|
|
3,221,654 |
| Calibration 3 |
|
|
3,225,108 |
| Calibration 4 |
|
|
3,228,529 |
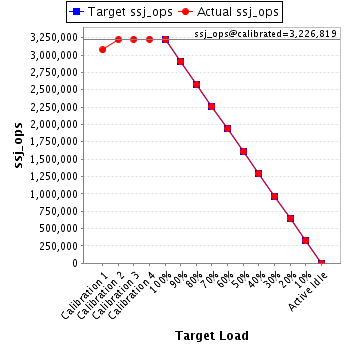
| ssj_ops@calibrated=3,226,819 |
| 100% |
100.0% |
3,226,819 |
3,225,889 |
| 90% |
90.0% |
2,904,137 |
2,902,629 |
| 80% |
80.0% |
2,581,455 |
2,581,718 |
| 70% |
69.9% |
2,258,773 |
2,257,036 |
| 60% |
60.0% |
1,936,091 |
1,937,693 |
| 50% |
49.9% |
1,613,409 |
1,610,750 |
| 40% |
40.0% |
1,290,727 |
1,292,208 |
| 30% |
30.0% |
968,046 |
967,509 |
| 20% |
20.0% |
645,364 |
646,139 |
| 10% |
10.0% |
322,682 |
323,987 |
| Active Idle |
|
0 |
0 |
| Hardware |
| Hardware Vendor: |
Fujitsu |
| Model: |
FUJITSU Server PRIMERGY CX2550 M1 |
| Form Factor: |
Blade |
| CPU Name: |
Intel Xeon E5-2699 v3 |
| CPU Characteristics: |
18-Core, 2.30GHz, 45MB L3 Cache |
| CPU Frequency (MHz): |
2300 |
| CPU(s) Enabled: |
36 cores, 2 chips, 18 cores/chip |
| Hardware Threads: |
72 (2 / core) |
| CPU(s) Orderable: |
1,2 chips |
| Primary Cache: |
32 KB I + 32 KB D on chip per core |
| Secondary Cache: |
256 KB I+D on chip per core |
| Tertiary Cache: |
45 MB I+D on chip per chip |
| Other Cache: |
None |
| Memory Amount (GB): |
64 |
| # and size of DIMM: |
8 x 8192 MB |
| Memory Details: |
8 GB DDR4, registered, ECC, 2133 MHz, PC4-2133R, DIMM, 2Rx8; slots 1A, 1B, 1C, 1D, 1E, 1F, 1G, 1H populated |
| Power Supply Quantity and Rating (W): |
None |
| Power Supply Details: |
N/A |
| Disk Drive: |
1 x SSD SATA 6G 64GB DOM N H-P, S26361-F5523-E64 |
| Disk Controller: |
Integrated SATA Controller |
| # and type of Network Interface Cards (NICs) Installed: |
2 x Intel I350 Gigabit Network Connection (onboard) |
| NICs Enabled in Firmware / OS / Connected: |
1/1/1 |
| Network Speed (Mbit): |
1000 |
| Keyboard: |
None |
| Mouse: |
None |
| Monitor: |
None |
| Optical Drives: |
No |
| Other Hardware: |
None |
| Software |
| Power Management: |
Enabled ("Fujitsu Enhanced Power Settings" power plan) |
| Operating System (OS): |
Microsoft Windows Server 2008 R2 Enterprise SP1 |
| OS Version: |
Version 6.1.7601 Service Pack 1 Build 7601 |
| Filesystem: |
NTFS |
| JVM Vendor: |
IBM Corporation |
| JVM Version: |
IBM J9 VM (build 2.6, JRE 1.7.0 Windows Server 2008 R2 amd64-64 20120322_106209 (JIT enabled, AOT enabled) |
| JVM Command-line Options: |
-Xmn825m -Xms975m -Xmx975m -Xaggressive -Xcompressedrefs -Xgcpolicy:gencon -XlockReservation -Xnoloa -XtlhPrefetch -Xlp -Xconcurrentlevel0 -Xthr:minimizeusercpu -Xgcthreads2 (-Xgcthreads1 for JVM5 and JVM23) |
| JVM Affinity: |
start /NODE [0,1,2,3] /AFFINITY [0x3,0xC,0x30,0xC0,0x300,0xC00,0x3000,0xC000,0x30000] |
| JVM Instances: |
36 |
| JVM Initial Heap (MB): |
975 |
| JVM Maximum Heap (MB): |
975 |
| JVM Address Bits: |
64 |
| Boot Firmware Version: |
R1.7.0 |
| Management Firmware Version: |
7.64F |
| Workload Version: |
SSJ 1.2.10 |
| Director Location: |
Controller |
| Other Software: |
IBM WebSphere Application Server V8.5.0.0, Microsoft Hotfix for Windows (KB2510206) |
| JVM Instance |
ssj_ops@100% |
| Node_02.001 |
90,367 |
| Node_02.002 |
89,642 |
| Node_02.003 |
90,735 |
| Node_02.004 |
91,324 |
| Node_02.005 |
87,263 |
| Node_02.006 |
89,633 |
| Node_02.007 |
90,725 |
| Node_02.008 |
89,653 |
| Node_02.009 |
91,092 |
| Node_02.010 |
87,648 |
| Node_02.011 |
88,724 |
| Node_02.012 |
89,502 |
| Node_02.013 |
90,146 |
| Node_02.014 |
89,568 |
| Node_02.015 |
88,900 |
| Node_02.016 |
89,259 |
| Node_02.017 |
90,009 |
| Node_02.018 |
89,343 |
| Node_02.019 |
89,921 |
| Node_02.020 |
88,630 |
| Node_02.021 |
91,892 |
| Node_02.022 |
88,403 |
| Node_02.023 |
87,293 |
| Node_02.024 |
90,657 |
| Node_02.025 |
90,511 |
| Node_02.026 |
89,650 |
| Node_02.027 |
89,531 |
| Node_02.028 |
87,909 |
| Node_02.029 |
87,412 |
| Node_02.030 |
91,611 |
| Node_02.031 |
89,168 |
| Node_02.032 |
89,874 |
| Node_02.033 |
90,190 |
| Node_02.034 |
90,513 |
| Node_02.035 |
89,520 |
| Node_02.036 |
89,670 |
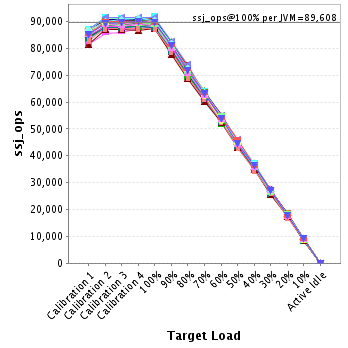
| ssj_ops@100% |
3,225,889 |
| ssj_ops@100% per JVM |
89,608 |
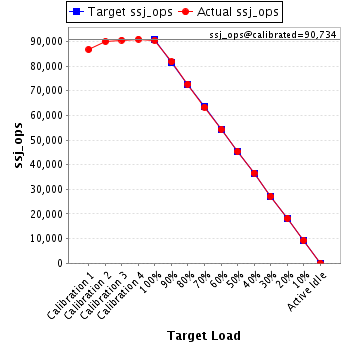
JVM 'Node_02.001' Scores:
| Target Load |
Actual Load |
ssj_ops |
| Target |
Actual |
| Calibration 1 |
|
|
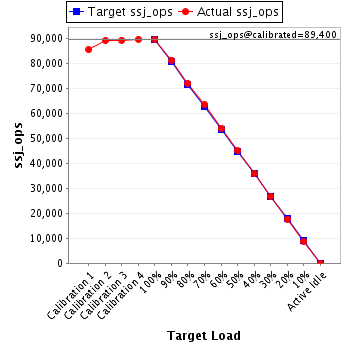
86,422 |
| Calibration 2 |
|
|
90,376 |
| Calibration 3 |
|
|
90,467 |
| Calibration 4 |
|
|
90,453 |
| ssj_ops@calibrated=90,460 |
| 100% |
99.9% |
90,460 |
90,367 |
| 90% |
89.5% |
81,414 |
80,930 |
| 80% |
79.7% |
72,368 |
72,094 |
| 70% |
70.5% |
63,322 |
63,802 |
| 60% |
60.4% |
54,276 |
54,628 |
| 50% |
49.8% |
45,230 |
45,055 |
| 40% |
40.1% |
36,184 |
36,279 |
| 30% |
29.9% |
27,138 |
27,068 |
| 20% |
20.5% |
18,092 |
18,514 |
| 10% |
9.8% |
9,046 |
8,879 |
| Active Idle |
|
0 |
0 |
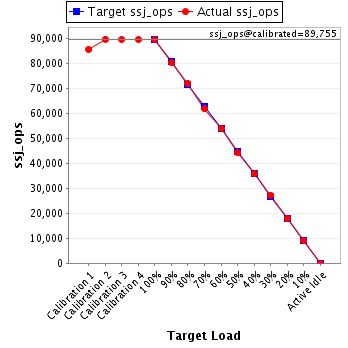
JVM 'Node_02.002' Scores:
| Target Load |
Actual Load |
ssj_ops |
| Target |
Actual |
| Calibration 1 |
|
|
85,725 |
| Calibration 2 |
|
|
89,848 |
| Calibration 3 |
|
|
89,784 |
| Calibration 4 |
|
|
89,725 |
| ssj_ops@calibrated=89,755 |
| 100% |
99.9% |
89,755 |
89,642 |
| 90% |
89.6% |
80,779 |
80,451 |
| 80% |
80.5% |
71,804 |
72,221 |
| 70% |
68.9% |
62,828 |
61,849 |
| 60% |
60.2% |
53,853 |
54,029 |
| 50% |
49.3% |
44,877 |
44,279 |
| 40% |
40.0% |
35,902 |
35,897 |
| 30% |
30.5% |
26,926 |
27,331 |
| 20% |
19.9% |
17,951 |
17,904 |
| 10% |
10.0% |
8,975 |
8,995 |
| Active Idle |
|
0 |
0 |
JVM 'Node_02.003' Scores:
| Target Load |
Actual Load |
ssj_ops |
| Target |
Actual |
| Calibration 1 |
|
|
86,262 |
| Calibration 2 |
|
|
90,632 |
| Calibration 3 |
|
|
90,957 |
| Calibration 4 |
|
|
90,556 |
| ssj_ops@calibrated=90,757 |
| 100% |
100.0% |
90,757 |
90,735 |
| 90% |
91.1% |
81,681 |
82,652 |
| 80% |
79.7% |
72,605 |
72,345 |
| 70% |
70.8% |
63,530 |
64,225 |
| 60% |
60.2% |
54,454 |
54,650 |
| 50% |
49.6% |
45,378 |
45,044 |
| 40% |
41.1% |
36,303 |
37,262 |
| 30% |
29.3% |
27,227 |
26,630 |
| 20% |
20.2% |
18,151 |
18,375 |
| 10% |
10.1% |
9,076 |
9,192 |
| Active Idle |
|
0 |
0 |
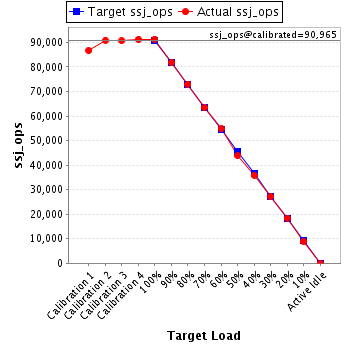
JVM 'Node_02.004' Scores:
| Target Load |
Actual Load |
ssj_ops |
| Target |
Actual |
| Calibration 1 |
|
|
86,653 |
| Calibration 2 |
|
|
90,937 |
| Calibration 3 |
|
|
90,675 |
| Calibration 4 |
|
|
91,256 |
| ssj_ops@calibrated=90,965 |
| 100% |
100.4% |
90,965 |
91,324 |
| 90% |
90.0% |
81,869 |
81,838 |
| 80% |
80.3% |
72,772 |
73,049 |
| 70% |
69.7% |
63,676 |
63,366 |
| 60% |
60.2% |
54,579 |
54,765 |
| 50% |
48.2% |
45,483 |
43,885 |
| 40% |
39.4% |
36,386 |
35,842 |
| 30% |
29.8% |
27,290 |
27,129 |
| 20% |
20.3% |
18,193 |
18,442 |
| 10% |
9.8% |
9,097 |
8,887 |
| Active Idle |
|
0 |
0 |
JVM 'Node_02.005' Scores:
| Target Load |
Actual Load |
ssj_ops |
| Target |
Actual |
| Calibration 1 |
|
|
81,449 |
| Calibration 2 |
|
|
85,619 |
| Calibration 3 |
|
|
86,034 |
| Calibration 4 |
|
|
87,385 |
| ssj_ops@calibrated=86,709 |
| 100% |
100.6% |
86,709 |
87,263 |
| 90% |
91.0% |
78,038 |
78,910 |
| 80% |
80.0% |
69,367 |
69,356 |
| 70% |
69.7% |
60,697 |
60,395 |
| 60% |
60.4% |
52,026 |
52,339 |
| 50% |
50.3% |
43,355 |
43,615 |
| 40% |
40.3% |
34,684 |
34,943 |
| 30% |
29.8% |
26,013 |
25,881 |
| 20% |
20.3% |
17,342 |
17,632 |
| 10% |
10.0% |
8,671 |
8,645 |
| Active Idle |
|
0 |
0 |
JVM 'Node_02.006' Scores:
| Target Load |
Actual Load |
ssj_ops |
| Target |
Actual |
| Calibration 1 |
|
|
86,369 |
| Calibration 2 |
|
|
90,185 |
| Calibration 3 |
|
|
90,166 |
| Calibration 4 |
|
|
90,327 |
| ssj_ops@calibrated=90,247 |
| 100% |
99.3% |
90,247 |
89,633 |
| 90% |
89.8% |
81,222 |
81,068 |
| 80% |
79.3% |
72,197 |
71,546 |
| 70% |
69.9% |
63,173 |
63,126 |
| 60% |
60.1% |
54,148 |
54,278 |
| 50% |
50.2% |
45,123 |
45,277 |
| 40% |
39.5% |
36,099 |
35,646 |
| 30% |
29.8% |
27,074 |
26,886 |
| 20% |
20.2% |
18,049 |
18,258 |
| 10% |
10.0% |
9,025 |
9,022 |
| Active Idle |
|
0 |
0 |
JVM 'Node_02.007' Scores:
| Target Load |
Actual Load |
ssj_ops |
| Target |
Actual |
| Calibration 1 |
|
|
85,494 |
| Calibration 2 |
|
|
90,796 |
| Calibration 3 |
|
|
90,467 |
| Calibration 4 |
|
|
90,680 |
| ssj_ops@calibrated=90,573 |
| 100% |
100.2% |
90,573 |
90,725 |
| 90% |
89.8% |
81,516 |
81,328 |
| 80% |
79.0% |
72,459 |
71,548 |
| 70% |
70.5% |
63,401 |
63,888 |
| 60% |
60.2% |
54,344 |
54,518 |
| 50% |
49.6% |
45,287 |
44,944 |
| 40% |
39.6% |
36,229 |
35,857 |
| 30% |
29.8% |
27,172 |
26,949 |
| 20% |
20.0% |
18,115 |
18,159 |
| 10% |
10.2% |
9,057 |
9,246 |
| Active Idle |
|
0 |
0 |
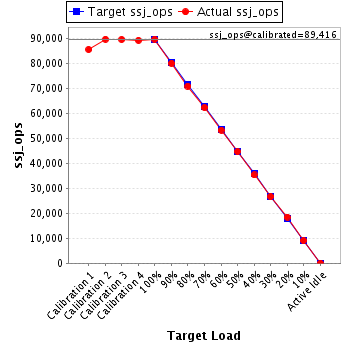
JVM 'Node_02.008' Scores:
| Target Load |
Actual Load |
ssj_ops |
| Target |
Actual |
| Calibration 1 |
|
|
85,557 |
| Calibration 2 |
|
|
89,707 |
| Calibration 3 |
|
|
89,565 |
| Calibration 4 |
|
|
89,268 |
| ssj_ops@calibrated=89,416 |
| 100% |
100.3% |
89,416 |
89,653 |
| 90% |
89.6% |
80,474 |
80,082 |
| 80% |
79.3% |
71,533 |
70,909 |
| 70% |
69.6% |
62,591 |
62,266 |
| 60% |
59.5% |
53,650 |
53,226 |
| 50% |
49.9% |
44,708 |
44,647 |
| 40% |
39.5% |
35,766 |
35,342 |
| 30% |
29.8% |
26,825 |
26,641 |
| 20% |
20.7% |
17,883 |
18,496 |
| 10% |
10.2% |
8,942 |
9,079 |
| Active Idle |
|
0 |
0 |
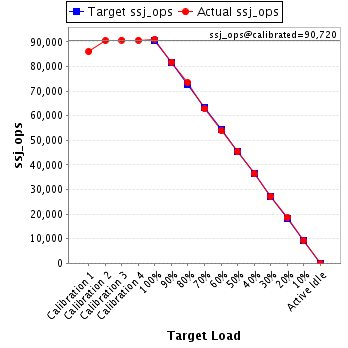
JVM 'Node_02.009' Scores:
| Target Load |
Actual Load |
ssj_ops |
| Target |
Actual |
| Calibration 1 |
|
|
86,075 |
| Calibration 2 |
|
|
90,553 |
| Calibration 3 |
|
|
90,724 |
| Calibration 4 |
|
|
90,716 |
| ssj_ops@calibrated=90,720 |
| 100% |
100.4% |
90,720 |
91,092 |
| 90% |
90.1% |
81,648 |
81,774 |
| 80% |
81.0% |
72,576 |
73,448 |
| 70% |
69.2% |
63,504 |
62,788 |
| 60% |
59.4% |
54,432 |
53,907 |
| 50% |
50.1% |
45,360 |
45,439 |
| 40% |
40.1% |
36,288 |
36,396 |
| 30% |
30.0% |
27,216 |
27,203 |
| 20% |
20.3% |
18,144 |
18,425 |
| 10% |
10.2% |
9,072 |
9,274 |
| Active Idle |
|
0 |
0 |
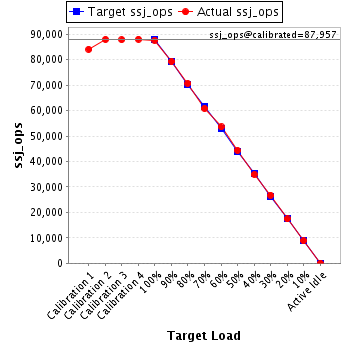
JVM 'Node_02.010' Scores:
| Target Load |
Actual Load |
ssj_ops |
| Target |
Actual |
| Calibration 1 |
|
|
84,114 |
| Calibration 2 |
|
|
87,983 |
| Calibration 3 |
|
|
87,836 |
| Calibration 4 |
|
|
88,077 |
| ssj_ops@calibrated=87,957 |
| 100% |
99.6% |
87,957 |
87,648 |
| 90% |
90.2% |
79,161 |
79,310 |
| 80% |
80.4% |
70,365 |
70,709 |
| 70% |
69.2% |
61,570 |
60,863 |
| 60% |
60.9% |
52,774 |
53,601 |
| 50% |
50.5% |
43,978 |
44,381 |
| 40% |
39.7% |
35,183 |
34,883 |
| 30% |
30.5% |
26,387 |
26,783 |
| 20% |
19.8% |
17,591 |
17,402 |
| 10% |
10.0% |
8,796 |
8,817 |
| Active Idle |
|
0 |
0 |
JVM 'Node_02.011' Scores:
| Target Load |
Actual Load |
ssj_ops |
| Target |
Actual |
| Calibration 1 |
|
|
84,159 |
| Calibration 2 |
|
|
88,147 |
| Calibration 3 |
|
|
88,218 |
| Calibration 4 |
|
|
88,249 |
| ssj_ops@calibrated=88,234 |
| 100% |
100.6% |
88,234 |
88,724 |
| 90% |
90.1% |
79,410 |
79,532 |
| 80% |
78.7% |
70,587 |
69,415 |
| 70% |
70.7% |
61,764 |
62,415 |
| 60% |
59.1% |
52,940 |
52,142 |
| 50% |
50.1% |
44,117 |
44,164 |
| 40% |
39.8% |
35,293 |
35,154 |
| 30% |
30.3% |
26,470 |
26,702 |
| 20% |
20.3% |
17,647 |
17,894 |
| 10% |
9.6% |
8,823 |
8,504 |
| Active Idle |
|
0 |
0 |
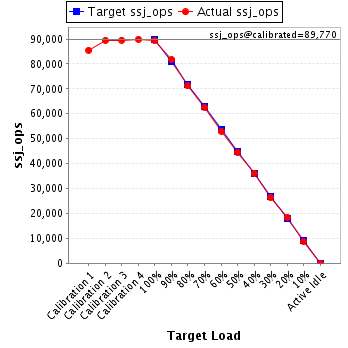
JVM 'Node_02.012' Scores:
| Target Load |
Actual Load |
ssj_ops |
| Target |
Actual |
| Calibration 1 |
|
|
85,497 |
| Calibration 2 |
|
|
89,502 |
| Calibration 3 |
|
|
89,586 |
| Calibration 4 |
|
|
89,953 |
| ssj_ops@calibrated=89,770 |
| 100% |
99.7% |
89,770 |
89,502 |
| 90% |
91.0% |
80,793 |
81,684 |
| 80% |
79.3% |
71,816 |
71,195 |
| 70% |
69.8% |
62,839 |
62,687 |
| 60% |
59.0% |
53,862 |
52,977 |
| 50% |
49.7% |
44,885 |
44,609 |
| 40% |
40.2% |
35,908 |
36,100 |
| 30% |
29.5% |
26,931 |
26,469 |
| 20% |
20.5% |
17,954 |
18,366 |
| 10% |
9.9% |
8,977 |
8,875 |
| Active Idle |
|
0 |
0 |
JVM 'Node_02.013' Scores:
| Target Load |
Actual Load |
ssj_ops |
| Target |
Actual |
| Calibration 1 |
|
|
85,550 |
| Calibration 2 |
|
|
90,025 |
| Calibration 3 |
|
|
90,283 |
| Calibration 4 |
|
|
89,929 |
| ssj_ops@calibrated=90,106 |
| 100% |
100.0% |
90,106 |
90,146 |
| 90% |
89.9% |
81,095 |
81,044 |
| 80% |
80.2% |
72,085 |
72,237 |
| 70% |
70.9% |
63,074 |
63,853 |
| 60% |
60.5% |
54,064 |
54,547 |
| 50% |
50.1% |
45,053 |
45,116 |
| 40% |
40.0% |
36,042 |
35,998 |
| 30% |
29.7% |
27,032 |
26,771 |
| 20% |
19.9% |
18,021 |
17,917 |
| 10% |
9.9% |
9,011 |
8,921 |
| Active Idle |
|
0 |
0 |
JVM 'Node_02.014' Scores:
| Target Load |
Actual Load |
ssj_ops |
| Target |
Actual |
| Calibration 1 |
|
|
85,349 |
| Calibration 2 |
|
|
89,100 |
| Calibration 3 |
|
|
89,216 |
| Calibration 4 |
|
|
89,584 |
| ssj_ops@calibrated=89,400 |
| 100% |
100.2% |
89,400 |
89,568 |
| 90% |
90.9% |
80,460 |
81,250 |
| 80% |
80.4% |
71,520 |
71,906 |
| 70% |
71.1% |
62,580 |
63,587 |
| 60% |
60.4% |
53,640 |
53,985 |
| 50% |
50.3% |
44,700 |
44,940 |
| 40% |
39.9% |
35,760 |
35,712 |
| 30% |
29.9% |
26,820 |
26,767 |
| 20% |
19.8% |
17,880 |
17,667 |
| 10% |
9.8% |
8,940 |
8,783 |
| Active Idle |
|
0 |
0 |
JVM 'Node_02.015' Scores:
| Target Load |
Actual Load |
ssj_ops |
| Target |
Actual |
| Calibration 1 |
|
|
84,087 |
| Calibration 2 |
|
|
88,656 |
| Calibration 3 |
|
|
88,873 |
| Calibration 4 |
|
|
89,224 |
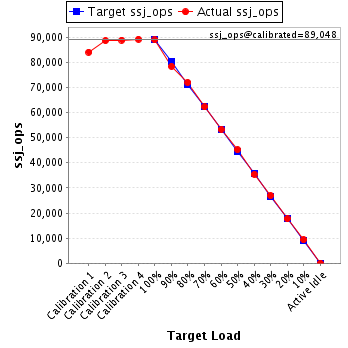
| ssj_ops@calibrated=89,048 |
| 100% |
99.8% |
89,048 |
88,900 |
| 90% |
88.1% |
80,143 |
78,432 |
| 80% |
80.8% |
71,239 |
71,977 |
| 70% |
69.9% |
62,334 |
62,236 |
| 60% |
59.9% |
53,429 |
53,303 |
| 50% |
50.8% |
44,524 |
45,218 |
| 40% |
39.8% |
35,619 |
35,397 |
| 30% |
30.3% |
26,714 |
26,943 |
| 20% |
19.9% |
17,810 |
17,688 |
| 10% |
10.5% |
8,905 |
9,371 |
| Active Idle |
|
0 |
0 |
JVM 'Node_02.016' Scores:
| Target Load |
Actual Load |
ssj_ops |
| Target |
Actual |
| Calibration 1 |
|
|
86,046 |
| Calibration 2 |
|
|
89,765 |
| Calibration 3 |
|
|
89,858 |
| Calibration 4 |
|
|
89,979 |
| ssj_ops@calibrated=89,918 |
| 100% |
99.3% |
89,918 |
89,259 |
| 90% |
89.8% |
80,927 |
80,786 |
| 80% |
80.1% |
71,935 |
72,030 |
| 70% |
69.8% |
62,943 |
62,754 |
| 60% |
59.3% |
53,951 |
53,316 |
| 50% |
50.0% |
44,959 |
44,971 |
| 40% |
39.6% |
35,967 |
35,583 |
| 30% |
30.2% |
26,976 |
27,200 |
| 20% |
19.9% |
17,984 |
17,891 |
| 10% |
9.9% |
8,992 |
8,869 |
| Active Idle |
|
0 |
0 |
JVM 'Node_02.017' Scores:
| Target Load |
Actual Load |
ssj_ops |
| Target |
Actual |
| Calibration 1 |
|
|
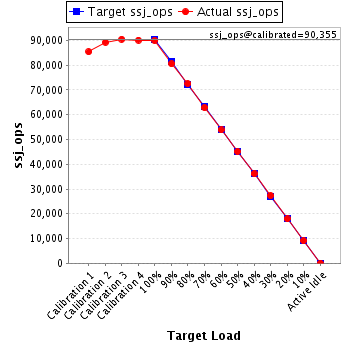
85,420 |
| Calibration 2 |
|
|
89,316 |
| Calibration 3 |
|
|
90,529 |
| Calibration 4 |
|
|
90,180 |
| ssj_ops@calibrated=90,355 |
| 100% |
99.6% |
90,355 |
90,009 |
| 90% |
89.1% |
81,319 |
80,528 |
| 80% |
80.3% |
72,284 |
72,591 |
| 70% |
69.5% |
63,248 |
62,803 |
| 60% |
59.6% |
54,213 |
53,881 |
| 50% |
50.0% |
45,177 |
45,140 |
| 40% |
40.0% |
36,142 |
36,146 |
| 30% |
30.2% |
27,106 |
27,296 |
| 20% |
19.8% |
18,071 |
17,916 |
| 10% |
10.0% |
9,035 |
9,074 |
| Active Idle |
|
0 |
0 |
JVM 'Node_02.018' Scores:
| Target Load |
Actual Load |
ssj_ops |
| Target |
Actual |
| Calibration 1 |
|
|
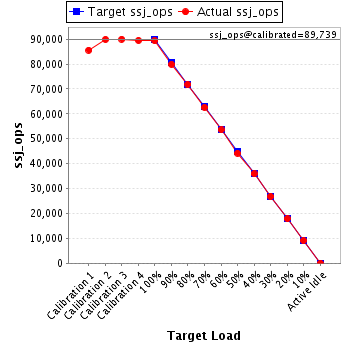
85,596 |
| Calibration 2 |
|
|
89,883 |
| Calibration 3 |
|
|
89,982 |
| Calibration 4 |
|
|
89,496 |
| ssj_ops@calibrated=89,739 |
| 100% |
99.6% |
89,739 |
89,343 |
| 90% |
89.1% |
80,765 |
79,925 |
| 80% |
80.0% |
71,791 |
71,786 |
| 70% |
69.7% |
62,817 |
62,581 |
| 60% |
59.7% |
53,843 |
53,605 |
| 50% |
49.3% |
44,869 |
44,217 |
| 40% |
40.0% |
35,896 |
35,901 |
| 30% |
29.9% |
26,922 |
26,828 |
| 20% |
19.9% |
17,948 |
17,867 |
| 10% |
10.2% |
8,974 |
9,162 |
| Active Idle |
|
0 |
0 |
JVM 'Node_02.019' Scores:
| Target Load |
Actual Load |
ssj_ops |
| Target |
Actual |
| Calibration 1 |
|
|
85,192 |
| Calibration 2 |
|
|
89,708 |
| Calibration 3 |
|
|
89,844 |
| Calibration 4 |
|
|
89,487 |
| ssj_ops@calibrated=89,665 |
| 100% |
100.3% |
89,665 |
89,921 |
| 90% |
90.0% |
80,699 |
80,698 |
| 80% |
79.7% |
71,732 |
71,437 |
| 70% |
70.3% |
62,766 |
63,010 |
| 60% |
59.6% |
53,799 |
53,484 |
| 50% |
50.1% |
44,833 |
44,895 |
| 40% |
41.0% |
35,866 |
36,735 |
| 30% |
29.6% |
26,900 |
26,528 |
| 20% |
19.9% |
17,933 |
17,842 |
| 10% |
10.1% |
8,967 |
9,083 |
| Active Idle |
|
0 |
0 |
JVM 'Node_02.020' Scores:
| Target Load |
Actual Load |
ssj_ops |
| Target |
Actual |
| Calibration 1 |
|
|
84,779 |
| Calibration 2 |
|
|
88,215 |
| Calibration 3 |
|
|
88,191 |
| Calibration 4 |
|
|
88,724 |
| ssj_ops@calibrated=88,458 |
| 100% |
100.2% |
88,458 |
88,630 |
| 90% |
89.9% |
79,612 |
79,557 |
| 80% |
80.9% |
70,766 |
71,604 |
| 70% |
68.8% |
61,920 |
60,860 |
| 60% |
60.8% |
53,075 |
53,760 |
| 50% |
50.0% |
44,229 |
44,238 |
| 40% |
39.4% |
35,383 |
34,837 |
| 30% |
30.6% |
26,537 |
27,051 |
| 20% |
19.9% |
17,692 |
17,564 |
| 10% |
10.2% |
8,846 |
9,025 |
| Active Idle |
|
0 |
0 |
JVM 'Node_02.021' Scores:
| Target Load |
Actual Load |
ssj_ops |
| Target |
Actual |
| Calibration 1 |
|
|
86,989 |
| Calibration 2 |
|
|
91,370 |
| Calibration 3 |
|
|
91,064 |
| Calibration 4 |
|
|
90,617 |
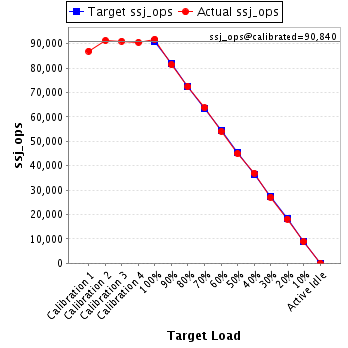
| ssj_ops@calibrated=90,840 |
| 100% |
101.2% |
90,840 |
91,892 |
| 90% |
89.6% |
81,756 |
81,395 |
| 80% |
79.7% |
72,672 |
72,413 |
| 70% |
70.2% |
63,588 |
63,761 |
| 60% |
59.5% |
54,504 |
54,061 |
| 50% |
49.6% |
45,420 |
45,031 |
| 40% |
40.7% |
36,336 |
36,947 |
| 30% |
29.9% |
27,252 |
27,151 |
| 20% |
20.0% |
18,168 |
18,149 |
| 10% |
9.8% |
9,084 |
8,867 |
| Active Idle |
|
0 |
0 |
JVM 'Node_02.022' Scores:
| Target Load |
Actual Load |
ssj_ops |
| Target |
Actual |
| Calibration 1 |
|
|
85,435 |
| Calibration 2 |
|
|
89,677 |
| Calibration 3 |
|
|
89,331 |
| Calibration 4 |
|
|
89,523 |
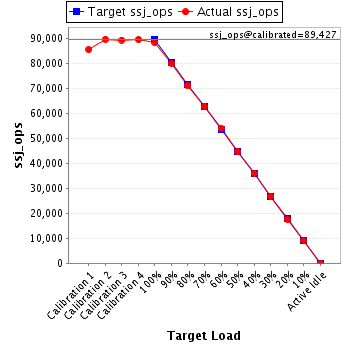
| ssj_ops@calibrated=89,427 |
| 100% |
98.9% |
89,427 |
88,403 |
| 90% |
89.5% |
80,484 |
80,045 |
| 80% |
79.5% |
71,542 |
71,083 |
| 70% |
70.2% |
62,599 |
62,804 |
| 60% |
60.5% |
53,656 |
54,090 |
| 50% |
49.9% |
44,714 |
44,610 |
| 40% |
40.2% |
35,771 |
35,988 |
| 30% |
30.0% |
26,828 |
26,849 |
| 20% |
19.7% |
17,885 |
17,641 |
| 10% |
10.1% |
8,943 |
9,003 |
| Active Idle |
|
0 |
0 |
JVM 'Node_02.023' Scores:
| Target Load |
Actual Load |
ssj_ops |
| Target |
Actual |
| Calibration 1 |
|
|
81,277 |
| Calibration 2 |
|
|
87,093 |
| Calibration 3 |
|
|
86,977 |
| Calibration 4 |
|
|
86,560 |
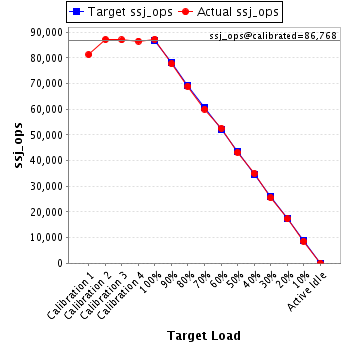
| ssj_ops@calibrated=86,768 |
| 100% |
100.6% |
86,768 |
87,293 |
| 90% |
89.5% |
78,092 |
77,653 |
| 80% |
79.4% |
69,415 |
68,916 |
| 70% |
69.2% |
60,738 |
60,047 |
| 60% |
60.6% |
52,061 |
52,565 |
| 50% |
49.8% |
43,384 |
43,199 |
| 40% |
40.3% |
34,707 |
35,008 |
| 30% |
29.4% |
26,031 |
25,532 |
| 20% |
19.9% |
17,354 |
17,296 |
| 10% |
9.9% |
8,677 |
8,579 |
| Active Idle |
|
0 |
0 |
JVM 'Node_02.024' Scores:
| Target Load |
Actual Load |
ssj_ops |
| Target |
Actual |
| Calibration 1 |
|
|
86,311 |
| Calibration 2 |
|
|
90,633 |
| Calibration 3 |
|
|
90,645 |
| Calibration 4 |
|
|
90,648 |
| ssj_ops@calibrated=90,646 |
| 100% |
100.0% |
90,646 |
90,657 |
| 90% |
90.6% |
81,582 |
82,108 |
| 80% |
80.0% |
72,517 |
72,561 |
| 70% |
69.3% |
63,453 |
62,837 |
| 60% |
59.7% |
54,388 |
54,155 |
| 50% |
49.3% |
45,323 |
44,680 |
| 40% |
40.1% |
36,259 |
36,393 |
| 30% |
30.4% |
27,194 |
27,555 |
| 20% |
20.2% |
18,129 |
18,271 |
| 10% |
9.9% |
9,065 |
8,987 |
| Active Idle |
|
0 |
0 |
JVM 'Node_02.025' Scores:
| Target Load |
Actual Load |
ssj_ops |
| Target |
Actual |
| Calibration 1 |
|
|
86,379 |
| Calibration 2 |
|
|
90,371 |
| Calibration 3 |
|
|
90,361 |
| Calibration 4 |
|
|
90,527 |
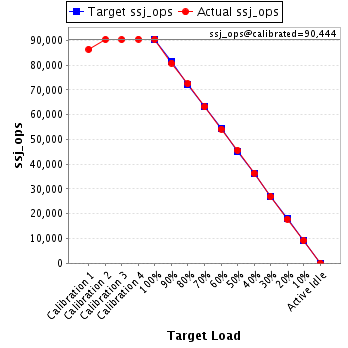
| ssj_ops@calibrated=90,444 |
| 100% |
100.1% |
90,444 |
90,511 |
| 90% |
89.4% |
81,399 |
80,835 |
| 80% |
80.2% |
72,355 |
72,561 |
| 70% |
69.8% |
63,311 |
63,151 |
| 60% |
59.9% |
54,266 |
54,170 |
| 50% |
50.4% |
45,222 |
45,606 |
| 40% |
40.2% |
36,177 |
36,347 |
| 30% |
29.8% |
27,133 |
26,931 |
| 20% |
19.7% |
18,089 |
17,837 |
| 10% |
10.1% |
9,044 |
9,166 |
| Active Idle |
|
0 |
0 |
JVM 'Node_02.026' Scores:
| Target Load |
Actual Load |
ssj_ops |
| Target |
Actual |
| Calibration 1 |
|
|
86,374 |
| Calibration 2 |
|
|
89,921 |
| Calibration 3 |
|
|
90,170 |
| Calibration 4 |
|
|
90,020 |
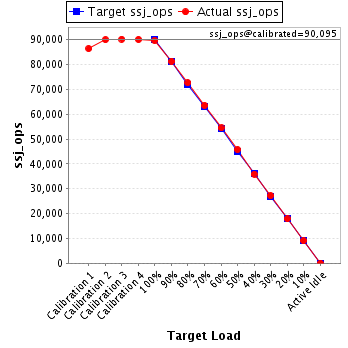
| ssj_ops@calibrated=90,095 |
| 100% |
99.5% |
90,095 |
89,650 |
| 90% |
90.2% |
81,086 |
81,284 |
| 80% |
80.6% |
72,076 |
72,619 |
| 70% |
70.5% |
63,067 |
63,534 |
| 60% |
60.4% |
54,057 |
54,439 |
| 50% |
50.8% |
45,048 |
45,724 |
| 40% |
39.8% |
36,038 |
35,874 |
| 30% |
30.2% |
27,029 |
27,178 |
| 20% |
19.8% |
18,019 |
17,862 |
| 10% |
10.0% |
9,010 |
9,041 |
| Active Idle |
|
0 |
0 |
JVM 'Node_02.027' Scores:
| Target Load |
Actual Load |
ssj_ops |
| Target |
Actual |
| Calibration 1 |
|
|
86,245 |
| Calibration 2 |
|
|
90,173 |
| Calibration 3 |
|
|
90,224 |
| Calibration 4 |
|
|
89,958 |
| ssj_ops@calibrated=90,091 |
| 100% |
99.4% |
90,091 |
89,531 |
| 90% |
90.0% |
81,082 |
81,074 |
| 80% |
80.1% |
72,073 |
72,189 |
| 70% |
70.7% |
63,064 |
63,665 |
| 60% |
61.4% |
54,055 |
55,284 |
| 50% |
50.0% |
45,046 |
45,056 |
| 40% |
40.0% |
36,036 |
36,078 |
| 30% |
30.1% |
27,027 |
27,087 |
| 20% |
20.4% |
18,018 |
18,387 |
| 10% |
10.3% |
9,009 |
9,267 |
| Active Idle |
|
0 |
0 |
JVM 'Node_02.028' Scores:
| Target Load |
Actual Load |
ssj_ops |
| Target |
Actual |
| Calibration 1 |
|
|
83,803 |
| Calibration 2 |
|
|
87,681 |
| Calibration 3 |
|
|
87,827 |
| Calibration 4 |
|
|
87,939 |
| ssj_ops@calibrated=87,883 |
| 100% |
100.0% |
87,883 |
87,909 |
| 90% |
90.0% |
79,095 |
79,100 |
| 80% |
81.0% |
70,306 |
71,211 |
| 70% |
69.5% |
61,518 |
61,046 |
| 60% |
60.0% |
52,730 |
52,733 |
| 50% |
49.7% |
43,941 |
43,704 |
| 40% |
39.8% |
35,153 |
34,989 |
| 30% |
29.6% |
26,365 |
26,033 |
| 20% |
20.0% |
17,577 |
17,615 |
| 10% |
9.8% |
8,788 |
8,595 |
| Active Idle |
|
0 |
0 |
JVM 'Node_02.029' Scores:
| Target Load |
Actual Load |
ssj_ops |
| Target |
Actual |
| Calibration 1 |
|
|
82,927 |
| Calibration 2 |
|
|
87,320 |
| Calibration 3 |
|
|
87,436 |
| Calibration 4 |
|
|
87,482 |
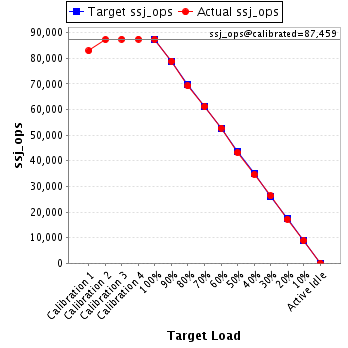
| ssj_ops@calibrated=87,459 |
| 100% |
99.9% |
87,459 |
87,412 |
| 90% |
90.2% |
78,713 |
78,914 |
| 80% |
79.2% |
69,967 |
69,264 |
| 70% |
69.9% |
61,221 |
61,165 |
| 60% |
60.3% |
52,475 |
52,745 |
| 50% |
49.4% |
43,730 |
43,211 |
| 40% |
39.6% |
34,984 |
34,625 |
| 30% |
30.0% |
26,238 |
26,262 |
| 20% |
19.6% |
17,492 |
17,175 |
| 10% |
10.1% |
8,746 |
8,812 |
| Active Idle |
|
0 |
0 |
JVM 'Node_02.030' Scores:
| Target Load |
Actual Load |
ssj_ops |
| Target |
Actual |
| Calibration 1 |
|
|
86,986 |
| Calibration 2 |
|
|
91,645 |
| Calibration 3 |
|
|
91,463 |
| Calibration 4 |
|
|
91,613 |
| ssj_ops@calibrated=91,538 |
| 100% |
100.1% |
91,538 |
91,611 |
| 90% |
90.3% |
82,384 |
82,636 |
| 80% |
81.0% |
73,230 |
74,134 |
| 70% |
69.0% |
64,077 |
63,164 |
| 60% |
59.9% |
54,923 |
54,872 |
| 50% |
50.2% |
45,769 |
45,993 |
| 40% |
39.5% |
36,615 |
36,117 |
| 30% |
29.3% |
27,461 |
26,785 |
| 20% |
19.8% |
18,308 |
18,136 |
| 10% |
10.1% |
9,154 |
9,225 |
| Active Idle |
|
0 |
0 |
JVM 'Node_02.031' Scores:
| Target Load |
Actual Load |
ssj_ops |
| Target |
Actual |
| Calibration 1 |
|
|
85,668 |
| Calibration 2 |
|
|
89,441 |
| Calibration 3 |
|
|
89,538 |
| Calibration 4 |
|
|
89,781 |
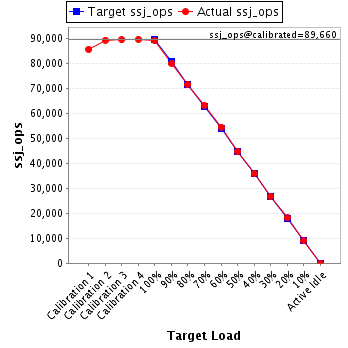
| ssj_ops@calibrated=89,660 |
| 100% |
99.5% |
89,660 |
89,168 |
| 90% |
89.4% |
80,694 |
80,143 |
| 80% |
79.9% |
71,728 |
71,655 |
| 70% |
70.5% |
62,762 |
63,226 |
| 60% |
60.9% |
53,796 |
54,592 |
| 50% |
50.0% |
44,830 |
44,813 |
| 40% |
40.1% |
35,864 |
35,946 |
| 30% |
29.8% |
26,898 |
26,678 |
| 20% |
20.3% |
17,932 |
18,156 |
| 10% |
10.0% |
8,966 |
8,962 |
| Active Idle |
|
0 |
0 |
JVM 'Node_02.032' Scores:
| Target Load |
Actual Load |
ssj_ops |
| Target |
Actual |
| Calibration 1 |
|
|
86,515 |
| Calibration 2 |
|
|
89,192 |
| Calibration 3 |
|
|
89,906 |
| Calibration 4 |
|
|
89,809 |
| ssj_ops@calibrated=89,857 |
| 100% |
100.0% |
89,857 |
89,874 |
| 90% |
90.6% |
80,872 |
81,418 |
| 80% |
80.1% |
71,886 |
72,020 |
| 70% |
69.6% |
62,900 |
62,558 |
| 60% |
59.2% |
53,914 |
53,192 |
| 50% |
49.5% |
44,929 |
44,456 |
| 40% |
40.8% |
35,943 |
36,660 |
| 30% |
30.2% |
26,957 |
27,114 |
| 20% |
19.7% |
17,971 |
17,662 |
| 10% |
10.0% |
8,986 |
8,995 |
| Active Idle |
|
0 |
0 |
JVM 'Node_02.033' Scores:
| Target Load |
Actual Load |
ssj_ops |
| Target |
Actual |
| Calibration 1 |
|
|
85,354 |
| Calibration 2 |
|
|
89,063 |
| Calibration 3 |
|
|
88,936 |
| Calibration 4 |
|
|
90,006 |
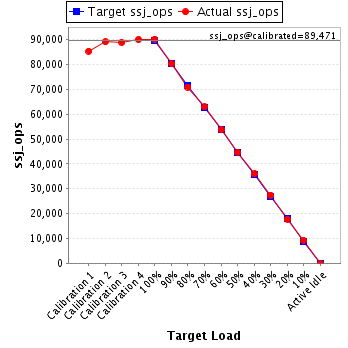
| ssj_ops@calibrated=89,471 |
| 100% |
100.8% |
89,471 |
90,190 |
| 90% |
89.6% |
80,524 |
80,211 |
| 80% |
79.3% |
71,577 |
70,935 |
| 70% |
70.4% |
62,630 |
62,958 |
| 60% |
60.1% |
53,683 |
53,763 |
| 50% |
50.0% |
44,735 |
44,751 |
| 40% |
40.2% |
35,788 |
35,927 |
| 30% |
30.7% |
26,841 |
27,468 |
| 20% |
19.9% |
17,894 |
17,800 |
| 10% |
10.2% |
8,947 |
9,170 |
| Active Idle |
|
0 |
0 |
JVM 'Node_02.034' Scores:
| Target Load |
Actual Load |
ssj_ops |
| Target |
Actual |
| Calibration 1 |
|
|
86,722 |
| Calibration 2 |
|
|
90,015 |
| Calibration 3 |
|
|
90,538 |
| Calibration 4 |
|
|
90,931 |
| ssj_ops@calibrated=90,734 |
| 100% |
99.8% |
90,734 |
90,513 |
| 90% |
90.1% |
81,661 |
81,744 |
| 80% |
80.1% |
72,588 |
72,655 |
| 70% |
69.8% |
63,514 |
63,371 |
| 60% |
59.9% |
54,441 |
54,312 |
| 50% |
50.0% |
45,367 |
45,344 |
| 40% |
40.3% |
36,294 |
36,611 |
| 30% |
30.0% |
27,220 |
27,225 |
| 20% |
20.1% |
18,147 |
18,255 |
| 10% |
10.2% |
9,073 |
9,262 |
| Active Idle |
|
0 |
0 |
JVM 'Node_02.035' Scores:
| Target Load |
Actual Load |
ssj_ops |
| Target |
Actual |
| Calibration 1 |
|
|
85,257 |
| Calibration 2 |
|
|
90,013 |
| Calibration 3 |
|
|
89,960 |
| Calibration 4 |
|
|
89,965 |
| ssj_ops@calibrated=89,963 |
| 100% |
99.5% |
89,963 |
89,520 |
| 90% |
90.2% |
80,966 |
81,162 |
| 80% |
80.5% |
71,970 |
72,388 |
| 70% |
70.3% |
62,974 |
63,210 |
| 60% |
60.1% |
53,978 |
54,082 |
| 50% |
51.2% |
44,981 |
46,060 |
| 40% |
40.4% |
35,985 |
36,359 |
| 30% |
30.6% |
26,989 |
27,515 |
| 20% |
19.7% |
17,993 |
17,754 |
| 10% |
10.0% |
8,996 |
8,994 |
| Active Idle |
|
0 |
0 |
JVM 'Node_02.036' Scores:
| Target Load |
Actual Load |
ssj_ops |
| Target |
Actual |
| Calibration 1 |
|
|
85,120 |
| Calibration 2 |
|
|
89,094 |
| Calibration 3 |
|
|
89,476 |
| Calibration 4 |
|
|
89,904 |
| ssj_ops@calibrated=89,690 |
| 100% |
100.0% |
89,690 |
89,670 |
| 90% |
90.5% |
80,721 |
81,126 |
| 80% |
80.0% |
71,752 |
71,712 |
| 70% |
70.4% |
62,783 |
63,181 |
| 60% |
59.9% |
53,814 |
53,697 |
| 50% |
49.5% |
44,845 |
44,437 |
| 40% |
40.6% |
35,876 |
36,429 |
| 30% |
30.2% |
26,907 |
27,090 |
| 20% |
20.0% |
17,938 |
17,924 |
| 10% |
10.4% |
8,969 |
9,358 |
| Active Idle |
|
0 |
0 |